Employment

The pages listed below are tagged with the Employment topic.

Employment by English Constituency

24%
18%
12%
6%
0%
Hexmap Aldershot: 14.1% Aldridge-Brownhills: 14.0% Altrincham and Sale West: 10.2% Amber Valley: 15.1% Arundel and South Downs: 10.1% Ashfield: 16.4% Ashford: 14.9% Ashton-under-Lyne: 17.6% Aylesbury: 14.2% Banbury: 13.0% Barking: 16.5% Barnsley Central: 16.3% Barnsley East: 18.9% Barrow and Furness: 15.0% Basildon and Billericay: 15.6% Basingstoke: 13.3% Bassetlaw: 15.2% Bath: 4.6% Batley and Spen: 15.0% Battersea: 9.8% Beaconsfield: 10.8% Beckenham: 10.8% Bedford: 15.1% Bermondsey and Old Southwark: 9.3% Berwick-upon-Tweed: 17.5% Bethnal Green and Bow: 11.2% Beverley and Holderness: 11.8% Bexhill and Battle: 14.6% Bexleyheath and Crayford: 13.3% Birkenhead: 21.4% Birmingham, Edgbaston: 11.8% Birmingham, Erdington: 22.2% Birmingham, Hall Green: 16.5% Birmingham, Hodge Hill: 19.9% Birmingham, Ladywood: 11.6% Birmingham, Northfield: 19.8% Birmingham, Perry Barr: 18.1% Birmingham, Selly Oak: 7.9% Birmingham, Yardley: 19.5% Bishop Auckland: 19.4% Blackburn: 16.2% Blackley and Broughton: 17.4% Blackpool North and Cleveleys: 19.5% Blackpool South: 22.6% Blaydon: 16.1% Blyth Valley: 19.5% Bognor Regis and Littlehampton: 13.5% Bolsover: 15.3% Bolton North East: 18.8% Bolton South East: 16.5% Bolton West: 13.5% Bootle: 21.0% Boston and Skegness: 17.3% Bosworth: 11.6% Bournemouth East: 11.4% Bournemouth West: 7.2% Bracknell: 11.4% Bradford East: 20.5% Bradford South: 18.8% Bradford West: 18.7% Braintree: 12.7% Brent Central: 13.9% Brent North: 12.9% Brentford and Isleworth: 13.3% Brentwood and Ongar: 11.6% Bridgwater and West Somerset: 13.9% Brigg and Goole: 14.0% Brighton, Kemptown: 11.0% Brighton, Pavilion: 6.3% Bristol East: 10.8% Bristol North West: 9.5% Bristol South: 15.1% Bristol West: 4.4% Broadland: 12.7% Bromley and Chislehurst: 13.6% Bromsgrove: 10.9% Broxbourne: 13.4% Broxtowe: 9.5% Buckingham: 9.6% Burnley: 18.6% Burton: 14.0% Bury North: 14.8% Bury South: 14.7% Bury St Edmunds: 11.7% Calder Valley: 13.6% Camberwell and Peckham: 14.4% Camborne and Redruth: 12.7% Cambridge: 4.1% Cannock Chase: 15.5% Canterbury: 6.5% Carlisle: 13.6% Carshalton and Wallington: 13.1% Castle Point: 13.1% Central Devon: 11.9% Central Suffolk and North Ipswich: 10.6% Charnwood: 10.7% Chatham and Aylesford: 16.5% Cheadle: 10.4% Chelmsford: 11.7% Chelsea and Fulham: 8.9% Cheltenham: 9.9% Chesham and Amersham: 10.0% Chesterfield: 16.4% Chichester: 10.3% Chingford and Woodford Green: 14.5% Chippenham: 11.3% Chipping Barnet: 13.8% Chorley: 12.7% Christchurch: 11.9% Cities of London and Westminster: 6.8% City of Chester: 9.9% City of Durham: 5.3% Clacton: 20.6% Cleethorpes: 13.4% Colchester: 11.0% Colne Valley: 12.3% Congleton: 9.8% Copeland: 13.7% Corby: 12.7% Coventry North East: 15.1% Coventry North West: 12.4% Coventry South: 6.2% Crawley: 15.6% Crewe and Nantwich: 14.5% Croydon Central: 15.5% Croydon North: 17.0% Croydon South: 13.0% Dagenham and Rainham: 15.8% Darlington: 17.6% Dartford: 14.1% Daventry: 11.7% Denton and Reddish: 15.7% Derby North: 10.8% Derby South: 19.7% Derbyshire Dales: 11.3% Devizes: 12.7% Dewsbury: 14.2% Don Valley: 18.4% Doncaster Central: 19.4% Doncaster North: 21.0% Dover: 16.9% Dudley North: 18.9% Dudley South: 17.2% Dulwich and West Norwood: 14.0% Ealing Central and Acton: 11.0% Ealing North: 14.3% Ealing, Southall: 13.8% Easington: 20.5% East Devon: 11.5% East Ham: 15.1% East Hampshire: 11.0% East Surrey: 12.1% East Worthing and Shoreham: 13.3% East Yorkshire: 13.2% Eastbourne: 14.7% Eastleigh: 11.5% Eddisbury: 11.8% Edmonton: 17.9% Ellesmere Port and Neston: 13.8% Elmet and Rothwell: 12.1% Eltham: 16.5% Enfield North: 15.4% Enfield, Southgate: 14.9% Epping Forest: 13.5% Epsom and Ewell: 9.7% Erewash: 15.6% Erith and Thamesmead: 19.2% Esher and Walton: 10.8% Exeter: 4.8% Fareham: 10.1% Faversham and Mid Kent: 14.6% Feltham and Heston: 15.9% Filton and Bradley Stoke: 7.1% Finchley and Golders Green: 12.9% Folkestone and Hythe: 17.8% Forest of Dean: 12.4% Fylde: 11.9% Gainsborough: 14.2% Garston and Halewood: 16.2% Gateshead: 17.9% Gedling: 13.9% Gillingham and Rainham: 14.1% Gloucester: 12.8% Gosport: 14.6% Grantham and Stamford: 13.3% Gravesham: 17.2% Great Grimsby: 21.8% Great Yarmouth: 19.5% Greenwich and Woolwich: 14.3% Guildford: 5.2% Hackney North and Stoke Newington: 14.9% Hackney South and Shoreditch: 14.8% Halesowen and Rowley Regis: 16.4% Halifax: 17.7% Haltemprice and Howden: 9.7% Halton: 16.8% Hammersmith: 11.5% Hampstead and Kilburn: 11.1% Harborough: 9.7% Harlow: 15.2% Harrogate and Knaresborough: 8.9% Harrow East: 12.6% Harrow West: 11.8% Hartlepool: 19.4% Harwich and North Essex: 11.4% Hastings and Rye: 18.5% Havant: 14.7% Hayes and Harlington: 14.9% Hazel Grove: 12.8% Hemel Hempstead: 13.7% Hemsworth: 17.2% Hendon: 13.2% Henley: 10.2% Hereford and South Herefordshire: 13.4% Hertford and Stortford: 11.1% Hertsmere: 12.6% Hexham: 11.9% Heywood and Middleton: 17.5% High Peak: 13.2% Hitchin and Harpenden: 10.4% Holborn and St Pancras: 8.6% Hornchurch and Upminster: 13.1% Hornsey and Wood Green: 15.4% Horsham: 10.0% Houghton and Sunderland South: 17.3% Hove: 13.0% Huddersfield: 12.3% Huntingdon: 11.9% Hyndburn: 16.6% Ilford North: 12.7% Ilford South: 14.4% Ipswich: 15.3% Isle of Wight: 16.7% Islington North: 14.2% Islington South and Finsbury: 11.9% Jarrow: 15.7% Keighley: 13.9% Kenilworth and Southam: 6.5% Kensington: 11.8% Kettering: 13.9% Kingston and Surbiton: 9.1% Kingston upon Hull East: 18.1% Kingston upon Hull North: 13.3% Kingston upon Hull West and Hessle: 18.3% Kingswood: 10.2% Knowsley: 20.2% Lancaster and Fleetwood: 6.9% Leeds Central: 7.7% Leeds East: 18.9% Leeds North East: 12.6% Leeds North West: 4.2% Leeds West: 15.5% Leicester East: 14.5% Leicester South: 8.3% Leicester West: 13.6% Leigh: 14.7% Lewes: 14.5% Lewisham East: 17.1% Lewisham West and Penge: 16.6% Lewisham, Deptford: 14.4% Leyton and Wanstead: 15.1% Lichfield: 10.9% Lincoln: 8.1% Liverpool, Riverside: 5.0% Liverpool, Walton: 19.6% Liverpool, Wavertree: 9.6% Liverpool, West Derby: 18.5% Loughborough: 5.7% Louth and Horncastle: 16.9% Ludlow: 13.0% Luton North: 14.6% Luton South: 15.9% Macclesfield: 10.3% Maidenhead: 11.0% Maidstone and The Weald: 14.1% Makerfield: 15.3% Maldon: 11.4% Manchester Central: 8.1% Manchester, Gorton: 9.7% Manchester, Withington: 7.5% Mansfield: 16.7% Meon Valley: 10.4% Meriden: 16.1% Mid Bedfordshire: 9.3% Mid Derbyshire: 10.1% Mid Dorset and North Poole: 9.9% Mid Norfolk: 13.3% Mid Sussex: 10.9% Mid Worcestershire: 12.6% Middlesbrough: 17.8% Middlesbrough South and East Cleveland: 17.2% Milton Keynes North: 13.4% Milton Keynes South: 14.0% Mitcham and Morden: 14.6% Mole Valley: 10.2% Morecambe and Lunesdale: 14.8% Morley and Outwood: 11.7% New Forest East: 12.6% New Forest West: 11.4% Newark: 13.1% Newbury: 11.5% Newcastle upon Tyne Central: 10.8% Newcastle upon Tyne East: 5.4% Newcastle upon Tyne North: 14.4% Newcastle-under-Lyme: 9.1% Newton Abbot: 13.7% Normanton, Pontefract and Castleford: 17.1% North Cornwall: 15.3% North Devon: 14.6% North Dorset: 10.8% North Durham: 17.7% North East Bedfordshire: 10.6% North East Cambridgeshire: 16.4% North East Derbyshire: 14.5% North East Hampshire: 9.1% North East Hertfordshire: 12.1% North East Somerset: 9.0% North Herefordshire: 12.9% North Norfolk: 16.3% North Shropshire: 12.8% North Somerset: 9.0% North Swindon: 12.8% North Thanet: 17.1% North Tyneside: 17.3% North Warwickshire: 13.5% North West Cambridgeshire: 12.8% North West Durham: 17.9% North West Hampshire: 11.6% North West Leicestershire: 10.9% North West Norfolk: 16.1% North Wiltshire: 11.0% Northampton North: 12.9% Northampton South: 12.1% Norwich North: 15.6% Norwich South: 7.9% Nottingham East: 8.2% Nottingham North: 19.8% Nottingham South: 4.2% Nuneaton: 15.5% Old Bexley and Sidcup: 10.6% Oldham East and Saddleworth: 18.5% Oldham West and Royton: 18.5% Orpington: 12.0% Oxford East: 4.6% Oxford West and Abingdon: 6.8% Pendle: 15.7% Penistone and Stocksbridge: 12.5% Penrith and The Border: 10.3% Peterborough: 19.3% Plymouth, Moor View: 16.0% Plymouth, Sutton and Devonport: 8.8% Poole: 14.3% Poplar and Limehouse: 12.4% Portsmouth North: 13.2% Portsmouth South: 7.3% Preston: 11.7% Pudsey: 9.9% Putney: 10.6% Rayleigh and Wickford: 10.3% Reading East: 7.2% Reading West: 13.8% Redcar: 19.7% Redditch: 14.1% Reigate: 12.6% Ribble Valley: 8.9% Richmond (Yorks): 13.6% Richmond Park: 10.3% Rochdale: 17.1% Rochester and Strood: 15.7% Rochford and Southend East: 18.2% Romford: 14.9% Romsey and Southampton North: 6.7% Rossendale and Darwen: 14.7% Rother Valley: 14.3% Rotherham: 21.2% Rugby: 10.9% Ruislip, Northwood and Pinner: 12.1% Runnymede and Weybridge: 7.2% Rushcliffe: 7.9% Rutland and Melton: 11.3% Saffron Walden: 10.1% Salford and Eccles: 10.7% Salisbury: 12.0% Scarborough and Whitby: 16.3% Scunthorpe: 17.3% Sedgefield: 17.5% Sefton Central: 10.2% Selby and Ainsty: 10.7% Sevenoaks: 11.4% Sheffield Central: 4.6% Sheffield South East: 15.5% Sheffield, Brightside and Hillsborough: 21.0% Sheffield, Hallam: 5.3% Sheffield, Heeley: 18.3% Sherwood: 14.2% Shipley: 12.2% Shrewsbury and Atcham: 12.8% Sittingbourne and Sheppey: 19.6% Skipton and Ripon: 9.9% Sleaford and North Hykeham: 11.2% Slough: 14.5% Solihull: 10.7% Somerton and Frome: 12.4% South Basildon and East Thurrock: 15.2% South Cambridgeshire: 8.7% South Derbyshire: 11.0% South Dorset: 17.1% South East Cambridgeshire: 10.2% South East Cornwall: 13.7% South Holland and The Deepings: 13.5% South Leicestershire: 10.3% South Norfolk: 11.4% South Northamptonshire: 9.5% South Ribble: 11.9% South Shields: 20.0% South Staffordshire: 17.9% South Suffolk: 12.2% South Swindon: 14.3% South Thanet: 18.5% South West Bedfordshire: 13.6% South West Devon: 9.9% South West Hertfordshire: 10.8% South West Norfolk: 15.0% South West Surrey: 8.7% South West Wiltshire: 13.5% Southampton, Itchen: 10.6% Southampton, Test: 10.0% Southend West: 14.3% Southport: 14.0% Spelthorne: 13.9% St Albans: 10.9% St Austell and Newquay: 16.0% St Helens North: 17.1% St Helens South and Whiston: 17.4% St Ives: 15.1% Stafford: 12.2% Staffordshire Moorlands: 10.3% Stalybridge and Hyde: 15.9% Stevenage: 13.9% Stockport: 17.2% Stockton North: 21.5% Stockton South: 13.9% Stoke-on-Trent Central: 13.5% Stoke-on-Trent North: 17.1% Stoke-on-Trent South: 15.9% Stone: 9.8% Stourbridge: 14.5% Stratford-on-Avon: 10.9% Streatham: 12.6% Stretford and Urmston: 13.0% Stroud: 11.4% Suffolk Coastal: 13.7% Sunderland Central: 15.1% Surrey Heath: 10.3% Sutton Coldfield: 10.8% Sutton and Cheam: 11.7% Tamworth: 18.2% Tatton: 11.1% Taunton Deane: 11.9% Telford: 18.4% Tewkesbury: 11.0% The Cotswolds: 10.1% The Wrekin: 11.7% Thirsk and Malton: 11.3% Thornbury and Yate: 10.4% Thurrock: 15.2% Tiverton and Honiton: 12.1% Tonbridge and Malling: 11.6% Tooting: 11.0% Torbay: 16.3% Torridge and West Devon: 14.4% Totnes: 14.1% Tottenham: 16.9% Truro and Falmouth: 8.7% Tunbridge Wells: 12.3% Twickenham: 10.2% Tynemouth: 13.8% Uxbridge and South Ruislip: 10.2% Vauxhall: 10.1% Wakefield: 15.7% Wallasey: 17.4% Walsall North: 23.4% Walsall South: 19.0% Walthamstow: 15.7% Wansbeck: 20.3% Wantage: 11.3% Warley: 17.0% Warrington North: 15.5% Warrington South: 11.1% Warwick and Leamington: 8.4% Washington and Sunderland West: 18.3% Watford: 12.4% Waveney: 17.9% Wealden: 12.6% Weaver Vale: 13.4% Wellingborough: 13.9% Wells: 11.5% Welwyn Hatfield: 7.5% Wentworth and Dearne: 17.3% West Bromwich East: 19.1% West Bromwich West: 19.3% West Dorset: 12.9% West Ham: 14.7% West Lancashire: 8.2% West Suffolk: 13.8% West Worcestershire: 12.8% Westminster North: 13.2% Westmorland and Lonsdale: 8.9% Weston-Super-Mare: 13.0% Wigan: 15.0% Wimbledon: 10.6% Winchester: 7.0% Windsor: 9.6% Wirral South: 10.7% Wirral West: 12.2% Witham: 11.4% Witney: 10.9% Woking: 12.3% Wokingham: 8.3% Wolverhampton North East: 17.9% Wolverhampton South East: 19.9% Wolverhampton South West: 16.4% Worcester: 11.1% Workington: 15.4% Worsley and Eccles South: 18.8% Worthing West: 13.3% Wycombe: 11.9% Wyre Forest: 15.4% Wyre and Preston North: 7.9% Wythenshawe and Sale East: 18.5% Yeovil: 13.2% York Central: 6.2% York Outer: 4.9%

Economic statistics relating to employment for young people, by parliamentary consituency.

  • Employment
  • Unemployment
  • NEET
  • Economic inactivity

International Comparisons

<strong>Netherlands</strong>: 2020: 1st; 2021: 1st; 2022: 1stNetherlands111<strong>Iceland</strong>: 2020: 2nd; 2021: 2nd; 2022: 2ndIceland222<strong>Switzerland</strong>: 2020: 3rd; 2021: 4th; 2022: 5thSwitzerland345<strong>Australia</strong>: 2020: 4th; 2021: 3rd; 2022: 3rdAustralia433<strong>New Zealand</strong>: 2020: 5th; 2021: 5th; 2022: 4thNew Zealand554<strong>Denmark</strong>: 2020: 6th; 2021: 7th; 2022: 8thDenmark678<strong>United Kingdom</strong>: 2020: 7th; 2021: 9th; 2022: 9thUnited Kingdom799<strong>Austria</strong>: 2020: 8th; 2021: joint 10th; 2022: 10thAustria81010<strong>Canada</strong>: 2020: 9th; 2021: 6th; 2022: 6thCanada966<strong>Norway</strong>: 2020: 10th; 2021: 8th; 2022: 7thNorway1087<strong>Germany</strong>: 2020: 11th; 2021: 12th; 2022: 12thGermany111212<strong>Japan</strong>: 2020: 12th; 2021: 13th; 2022: 14thJapan121314<strong>United States</strong>: 2020: 13th; 2021: joint 10th; 2022: 11thUnited States131011<strong>Finland</strong>: 2020: 14th; 2021: 14th; 2022: 15thFinland141415<strong>Sweden</strong>: 2020: 15th; 2021: 17th; 2022: 16thSweden151716<strong>Israel</strong>: 2020: 16th; 2021: 18th; 2022: 17thIsrael161817<strong>Ireland</strong>: 2020: 17th; 2021: 15th; 2022: 13thIreland171513<strong>Estonia</strong>: 2020: 18th; 2021: 19th; 2022: 19thEstonia181919<strong>Colombia</strong>: 2020: 19th; 2021: 20th; 2022: 21stColombia192021<strong>Latvia</strong>: 2020: 20th; 2021: 26th; 2022: 25thLatvia202625<strong>Lithuania</strong>: 2020: 21st; 2021: 23rd; 2022: 24thLithuania212324<strong>Türkiye</strong>: 2020: 22nd; 2021: 21st; 2022: 20thTürkiye222120<strong>France</strong>: 2020: 23rd; 2021: 22nd; 2022: 22ndFrance232222<strong>Poland</strong>: 2020: 24th; 2021: 27th; 2022: 28thPoland242728<strong>Hungary</strong>: 2020: 25th; 2021: 28th; 2022: 29thHungary252829<strong>Russia</strong>: 2020: 26th; 2021: 31st; 2022: 0Russia2631<strong>Slovenia</strong>: 2020: 27th; 2021: 24th; 2022: 23rdSlovenia272423<strong>Costa Rica</strong>: 2020: 28th; 2021: 29th; 2022: 26thCosta Rica282926<strong>Korea</strong>: 2020: 29th; 2021: 30th; 2022: 27thKorea293027<strong>Czechia</strong>: 2020: 30th; 2021: 32nd; 2022: 32ndCzechia303232<strong>Luxembourg</strong>: 2020: 31st; 2021: 25th; 2022: 30thLuxembourg312530<strong>Belgium</strong>: 2020: 32nd; 2021: 33rd; 2022: 31stBelgium323331<strong>Portugal</strong>: 2020: 33rd; 2021: 34th; 2022: 33rdPortugal333433<strong>Slovak Republic</strong>: 2020: 34th; 2021: 36th; 2022: 36thSlovak Republic343636<strong>Chile</strong>: 2020: 35th; 2021: 35th; 2022: 34thChile353534<strong>Bulgaria</strong>: 2020: 36th; 2021: 39th; 2022: 38thBulgaria363938<strong>Spain</strong>: 2020: 37th; 2021: 37th; 2022: 35thSpain373735<strong>Italy</strong>: 2020: 38th; 2021: 38th; 2022: 37thItaly383837<strong>Greece</strong>: 2020: 39th; 2021: 40th; 2022: 39thGreece394039<strong>South Africa</strong>: 2020: 40th; 2021: 41st; 2022: 40thSouth Africa404140<strong>Mexico</strong>: 2020: 0; 2021: 16th; 2022: 18thMexico1618202020212022

This page will present international data on employment and education.

  • Employment
  • Unemployment
  • NEET

Risk of NEET Factors

most likely
least likely
Hexmap Adur: -2.84 Allerdale: 2.49 Amber Valley: 1.38 Arun: 2.36 Ashfield: 13.24 Ashford: 2.31 Babergh: -4.12 Barking and Dagenham: 8.12 Barnet: -13.05 Barnsley: 18.48 Barrow-in-Furness: 12.51 Basildon: 5.72 Basingstoke and Deane: -3.98 Bassetlaw: 10.88 Bath and North East Somerset: -14.23 Bedford: -0.49 Bexley: -7.25 Birmingham: 12.50 Blaby: -6.63 Blackburn with Darwen: 13.49 Blackpool: 32.18 Bolsover: 13.17 Bolton: 10.67 Boston: 13.01 Bournemouth, Christchurch and Poole: -2.88 Bracknell Forest: -12.50 Bradford: 17.32 Braintree: -1.90 Breckland: 4.76 Brent: -4.05 Brentwood: -12.06 Brighton and Hove: -6.41 Bristol, City of: -0.29 Broadland: -8.30 Bromley: -12.60 Bromsgrove: -8.81 Broxbourne: -1.66 Broxtowe: -4.12 Buckinghamshire: -11.45 Burnley: 20.15 Bury: 4.32 Calderdale: 8.23 Cambridge: -12.75 Camden: -5.38 Cannock Chase: 10.40 Canterbury: -5.90 Carlisle: 6.05 Castle Point: -3.65 Central Bedfordshire: -7.69 Charnwood: -10.10 Chelmsford: -10.93 Cheltenham: -8.97 Cherwell: -6.19 Cheshire East: -7.64 Cheshire West and Chester: -2.03 Chesterfield: 12.11 Chichester: -7.56 Chorley: -0.98 City of London: -27.49 Colchester: -3.99 Copeland: 1.06 Cornwall: 1.66 Cotswold: -14.36 County Durham: 13.71 Coventry: 4.72 Craven: -14.00 Crawley: 5.61 Croydon: -0.89 Dacorum: -6.01 Darlington: 16.40 Dartford: -1.76 Derby: 9.06 Derbyshire Dales: -9.95 Doncaster: 20.98 Dorset: -2.02 Dover: 8.58 Dudley: 11.47 Ealing: -10.75 East Cambridgeshire: -10.63 East Devon: -5.67 East Hampshire: -11.61 East Hertfordshire: -14.43 East Lindsey: 17.13 East Riding of Yorkshire: -7.39 East Staffordshire: 0.17 East Suffolk: 6.17 Eastbourne: 3.77 Eastleigh: -7.83 Eden: -9.29 Elmbridge: -16.13 Enfield: -1.45 Epping Forest: -4.93 Epsom and Ewell: -16.41 Erewash: 5.22 Exeter: -7.00 Fareham: -11.21 Fenland: 11.15 Folkestone and Hythe: 8.15 Forest of Dean: -1.76 Fylde: -3.25 Gateshead: 15.28 Gedling: 0.22 Gloucester: 1.72 Gosport: 7.10 Gravesham: 5.94 Great Yarmouth: 24.81 Greenwich: 3.85 Guildford: -14.57 Hackney: 9.96 Halton: 21.03 Hambleton: -10.24 Hammersmith and Fulham: -11.48 Harborough: -13.54 Haringey: 0.91 Harlow: 11.45 Harrogate: -12.68 Harrow: -13.97 Hart: -20.36 Hartlepool: 25.11 Hastings: 17.05 Havant: 6.98 Havering: -8.02 Herefordshire, County of: 0.34 Hertsmere: -5.07 High Peak: -1.57 Hillingdon: -6.12 Hinckley and Bosworth: -3.83 Horsham: -13.65 Hounslow: -3.56 Huntingdonshire: -6.11 Hyndburn: 15.65 Ipswich: 12.90 Isle of Wight: 11.24 Isles of Scilly: -11.40 Islington: 5.32 Kensington and Chelsea: -14.31 King's Lynn and West Norfolk: 7.40 Kingston upon Hull, City of: 20.52 Kingston upon Thames: -20.10 Kirklees: 4.18 Knowsley: 26.75 Lambeth: -4.35 Lancaster: -1.07 Leeds: 0.49 Leicester: 5.12 Lewes: 0.11 Lewisham: 1.53 Lichfield: -6.52 Lincoln: 7.38 Liverpool: 17.52 Luton: 4.22 Maidstone: -0.16 Maldon: -0.54 Malvern Hills: -3.81 Manchester: 10.11 Mansfield: 16.90 Medway: 7.18 Melton: -8.20 Mendip: -4.10 Merton: -13.04 Mid Devon: -0.65 Mid Suffolk: -8.33 Mid Sussex: -14.87 Middlesbrough: 32.38 Milton Keynes: -3.10 Mole Valley: -14.12 New Forest: -5.02 Newark and Sherwood: 3.68 Newcastle upon Tyne: 7.96 Newcastle-under-Lyme: 2.74 Newham: -0.33 North Devon: 3.41 North East Derbyshire: 4.08 North East Lincolnshire: 19.11 North Hertfordshire: -8.31 North Kesteven: -7.00 North Lincolnshire: 8.94 North Norfolk: 1.26 North Northamptonshire: 4.23 North Somerset: -5.68 North Tyneside: 6.65 North Warwickshire: 6.57 North West Leicestershire: -4.01 Northumberland: 9.39 Norwich: 6.78 Nottingham: 12.38 Nuneaton and Bedworth: 13.22 Oadby and Wigston: -6.38 Oldham: 15.63 Oxford: -8.81 Pendle: 10.18 Peterborough: 11.88 Plymouth: 9.59 Portsmouth: 1.76 Preston: 8.01 Reading: -6.53 Redbridge: -11.86 Redcar and Cleveland: 27.60 Redditch: 8.34 Reigate and Banstead: -9.90 Ribble Valley: -16.23 Richmond upon Thames: -22.07 Richmondshire: -5.68 Rochdale: 18.92 Rochford: -10.39 Rossendale: 8.82 Rother: 5.16 Rotherham: 19.91 Rugby: -4.10 Runnymede: -10.40 Rushcliffe: -17.80 Rushmoor: -2.20 Rutland: -17.78 Ryedale: -10.97 Salford: 13.51 Sandwell: 16.42 Scarborough: 10.41 Sedgemoor: 4.20 Sefton: 9.35 Selby: -5.64 Sevenoaks: -6.01 Sheffield: 7.10 Shropshire: 0.14 Slough: -0.94 Solihull: 0.52 Somerset West and Taunton: 2.96 South Cambridgeshire: -15.05 South Derbyshire: -5.54 South Gloucestershire: -10.02 South Hams: -7.33 South Holland: 3.85 South Kesteven: -4.79 South Lakeland: -11.29 South Norfolk: -8.57 South Oxfordshire: -14.48 South Ribble: 0.40 South Somerset: 1.96 South Staffordshire: -4.63 South Tyneside: 18.74 Southampton: 5.38 Southend-on-Sea: 0.48 Southwark: -1.28 Spelthorne: -3.59 St Albans: -18.58 St. Helens: 19.53 Stafford: -3.86 Staffordshire Moorlands: -2.76 Stevenage: 5.68 Stockport: 0.81 Stockton-on-Tees: 13.24 Stoke-on-Trent: 23.38 Stratford-on-Avon: -10.16 Stroud: -11.41 Sunderland: 21.36 Surrey Heath: -10.81 Sutton: -6.37 Swale: 9.19 Swindon: 2.01 Tameside: 17.76 Tamworth: 12.76 Tandridge: -9.72 Teignbridge: -1.25 Telford and Wrekin: 15.16 Tendring: 14.38 Test Valley: -7.99 Tewkesbury: -8.79 Thanet: 14.88 Three Rivers: -14.68 Thurrock: -0.61 Tonbridge and Malling: -6.34 Torbay: 16.04 Torridge: 5.91 Tower Hamlets: -4.66 Trafford: -10.64 Tunbridge Wells: -7.94 Uttlesford: -16.44 Vale of White Horse: -11.98 Wakefield: 14.65 Walsall: 16.63 Waltham Forest: -1.26 Wandsworth: -17.09 Warrington: -3.94 Warwick: -12.24 Watford: -8.95 Waverley: -17.33 Wealden: -10.11 Welwyn Hatfield: -6.92 West Berkshire: -11.74 West Devon: -2.28 West Lancashire: -1.37 West Lindsey: 4.16 West Northamptonshire: -3.49 West Oxfordshire: -11.39 West Suffolk: -2.31 Westminster: -10.46 Wigan: 11.24 Wiltshire: -5.80 Winchester: -17.41 Windsor and Maidenhead: -15.49 Wirral: 13.86 Woking: -8.60 Wokingham: -23.78 Wolverhampton: 16.00 Worcester: -0.36 Worthing: -3.78 Wychavon: -2.30 Wyre: 5.52 Wyre Forest: 6.50 York: -14.79

Data on factors that contribute to likelihood of NEET

  • Employment
  • Unemployment
  • NEET
  • Economic inactivity

Labour Market

Unemployment rate (young people)

13.9%Young people aged 16-24, unemployed as at Mar-May 2024 (seasonally adjusted)

Economic inactivity rate (young people)

41%Young people aged 16-24, economically inactive as at Mar-May 2024 (seasonally adjusted)

Unemployment rate (all working age)

4.5%People aged 16-64, unemployed as at Mar-May 2024 (seasonally adjusted)

Economic inactivity rate (all working age)

22.1%People aged 16-64, economically inactive as at Mar-May 2024 (seasonally adjusted)
  • Employment
  • Unemployment
  • Economic inactivity
  • Long-term unemployment
  • Gender
  • Aged 16-17
  • Aged 18-24
  • FTE
  • NFTE

NEET

Latest NEET Rate

12.6%Percentage of young people aged 16-24 who are NEET as at Jan-Mar 2024 (seasonally adjusted)

Latest NEET Rate - Men

13.9%Percentage of young men aged 16-24 who are NEET as at Jan-Mar 2024 (seasonally adjusted)

Latest NEET Rate - Women

11.2%Percentage of young women aged 16-24 who are NEET as at Jan-Mar 2024 (seasonally adjusted)
  • Gender
  • NEET
  • Employment
  • Education
  • Training

Vacancies

Latest monthly vacancies

889000Estimated number of open job vacancies in the last reported rolling quarter across the UK, Apr-Jun 2024.

Growth on previous quarter

-3.4%Estimated percentage change on last quarter, Mar-May 2024
  • Economic indicators
  • Employment
  • Vacancies
  • Employers
  • Trends
  • Sectors

Ethnic minority youth employment outcomes analysis

20%30%40%50%60%OtherMixed/MultipleOther AsianChineseBangladeshiIndianPakistaniBlack/African/ Caribbean/Black BritishWhiteEmployment White: 57.8 (+0.6, -0.3)Employment Black/African/ Caribbean/Black British: 34.9 (+3, -1.5)Employment Pakistani: 32.3 (+3.3, -1.7)Employment Indian: 40 (+3.9, -2)Employment Bangladeshi: 34.8 (+5.3, -2.6)Employment Chinese: 22.5 (+5.7, -2.7)Employment Other Asian: 34.7 (+4.7, -2.3)Employment Mixed/Multiple: 42.9 (+3.5, -1.7)Employment Other: 30.9 (+4.1, -2)Employment

This page will be used to visualise analysis of youth employment outcomes data from the Ethnic Minority Youth Employment Data Analysis report.

  • Employment
  • Gender
  • Education

Ethnic minority youth employment evidence gap analysis

100%20%30%40%50%60%70%80%90%Northern IrelandScotlandNorth WestNorth EastWalesSouth WestSouth EastLondonEast of EnglandWest MidlandsEast MidlandsYorkshire and HumberBangladeshi North East: 14.2 (+23.3, -9.9)Bangladeshi North West: 36.1 (+9.4, -8.5)Bangladeshi Yorkshire and Humber: 16.7 (+10.4, -7)Bangladeshi East Midlands: 31.3 (+14.1, -11.2)Bangladeshi West Midlands: 28.3 (+6.3, -5.5)Bangladeshi East of England: 40.5 (+10.4, -9.6)Bangladeshi London: 37.2 (+4, -3.8)Bangladeshi South East: 49.8 ± 12Bangladeshi South West: 49.4 (+21.4, -21.2)Bangladeshi Wales: 32.1 (+22.1, -16.3)Bangladeshi Scotland: 16.7 (+32, -12.6)Bangladeshi Northern Ireland: ?Black/African/Caribbean/Black British North East: 28.4 (+13.9, -10.7)Black/African/Caribbean/Black British North West: 36.8 (+5.5, -5.2)Black/African/Caribbean/Black British Yorkshire and Humber: 29.9 (+7.3, -6.4)Black/African/Caribbean/Black British East Midlands: 33.6 (+5.7, -5.3)Black/African/Caribbean/Black British West Midlands: 34 (+4.2, -3.9)Black/African/Caribbean/Black British East of England: 42.5 (+5.4, -5.2)Black/African/Caribbean/Black British London: 34.2 (+2.3, -2.2)Black/African/Caribbean/Black British South East: 32 (+5.1, -4.6)Black/African/Caribbean/Black British South West: 48.7 (+9.1, -8.9)Black/African/Caribbean/Black British Wales: 32.7 (+16.9, -13.4)Black/African/Caribbean/Black British Scotland: 41.2 (+9.8, -9.1)Black/African/Caribbean/Black British Northern Ireland: 27.1 (+19.6, -13.5)Chinese North East: 22.4 (+25.6, -14.1)Chinese North West: 22.1 (+15.6, -10.3)Chinese Yorkshire and Humber: 23 (+12, -8.7)Chinese East Midlands: 18.6 (+10.1, -7.1)Chinese West Midlands: 10.3 (+9.2, -5.2)Chinese East of England: 17.1 (+16.1, -9.2)Chinese London: 25 (+5.4, -4.7)Chinese South East: 14.4 (+7.6, -5.3)Chinese South West: 59.1 (+15.1, -17.1)Chinese Wales: 23.9 (+17.6, -11.6)Chinese Scotland: 31.9 (+14.7, -11.9)Chinese Northern Ireland: 15.1 (+11.6, -7.1)Indian North East: 33.5 (+13.2, -11)Indian North West: 40.9 (+6.4, -6)Indian Yorkshire and Humber: 43.7 (+9, -8.5)Indian East Midlands: 45.8 ± 4.8Indian West Midlands: 36.8 (+4.9, -4.7)Indian East of England: 35.1 (+8.5, -7.7)Indian London: 40.5 (+3.7, -3.6)Indian South East: 42.6 (+5.8, -5.6)Indian South West: 33.5 (+10.7, -9.3)Indian Wales: 19.4 (+14.8, -9.4)Indian Scotland: 24.4 (+11.9, -9)Indian Northern Ireland: 41.5 (+27.7, -23.2)Mixed/Multiple North East: 23.6 (+9.4, -7.4)Mixed/Multiple North West: 52 (+6.5, -6.7)Mixed/Multiple Yorkshire and Humber: 36.2 (+6.3, -5.9)Mixed/Multiple East Midlands: 40.1 (+6.5, -6.2)Mixed/Multiple West Midlands: 40.8 (+5.3, -5.1)Mixed/Multiple East of England: 47.9 (+5.2, -5.3)Mixed/Multiple London: 43.2 (+3.4, -3.3)Mixed/Multiple South East: 41.5 (+4.3, -4.2)Mixed/Multiple South West: 51.1 (+6, -6.1)Mixed/Multiple Wales: 53.7 (+10, -10.3)Mixed/Multiple Scotland: 36.6 (+9.7, -8.7)Mixed/Multiple Northern Ireland: 28.6 (+12.1, -9.6)Other North East: 34.1 (+14.4, -12)Other North West: 24.2 (+6.9, -5.7)Other Yorkshire and Humber: 44.7 (+7.7, -7.5)Other East Midlands: 35.1 (+11.8, -10.3)Other West Midlands: 25.1 (+6.7, -5.7)Other East of England: 41.4 (+9.6, -9)Other London: 31.9 (+3.4, -3.2)Other South East: 31.8 (+7, -6.3)Other South West: 24.8 (+10.7, -8.2)Other Wales: 21 (+11.3, -8.2)Other Scotland: 20.6 (+10.1, -7.4)Other Northern Ireland: 10.5 (+10.5, -5.6)Pakistani North East: 35.1 (+14.7, -12.3)Pakistani North West: 33.9 (+4, -3.8)Pakistani Yorkshire and Humber: 30.8 (+3.6, -3.3)Pakistani East Midlands: 22.2 (+8.2, -6.5)Pakistani West Midlands: 26.2 (+3.6, -3.2)Pakistani East of England: 44.4 (+7.9, -7.6)Pakistani London: 34.9 (+4.7, -4.4)Pakistani South East: 39.2 (+6.3, -5.9)Pakistani South West: 45.2 (+14.2, -13.4)Pakistani Wales: 11.1 (+18.6, -7.6)Pakistani Scotland: 33.2 (+8.8, -7.6)Pakistani Northern Ireland: 77.9 (+17.3, -39.5)Other Asian North East: 17 (+20.7, -10.5)Other Asian North West: 19.1 (+7.2, -5.5)Other Asian Yorkshire and Humber: 35.5 (+10.8, -9.5)Other Asian East Midlands: 40.2 (+9.2, -8.6)Other Asian West Midlands: 19.8 (+6.7, -5.3)Other Asian East of England: 39.7 (+8.8, -8.2)Other Asian London: 37.7 (+4.3, -4.1)Other Asian South East: 44.2 (+6.1, -5.9)Other Asian South West: 32.2 (+12.6, -10.4)Other Asian Wales: 34.7 (+14.6, -12.2)Other Asian Scotland: 38.7 (+17, -14.6)Other Asian Northern Ireland: 39.2 (+14.4, -12.8)White North East: 54.7 ± 1.3White North West: 57.6 (+0.8, -0.9)White Yorkshire and Humber: 57.3 ± 1White East Midlands: 59.8 (+1, -1.1)White West Midlands: 57.3 ± 1White East of England: 60.6 ± 0.9White London: 50.8 ± 1.2White South East: 60.3 (+0.8, -0.7)White South West: 61.4 ± 0.9White Wales: 55.7 ± 1.2White Scotland: 59.5 (+0.9, -1)White Northern Ireland: 48.8 (+1.1, -1)BangladeshiBlack/African/Caribbean/Black BritishChineseIndianMixed/MultipleOtherPakistaniOther AsianWhite

Data gaps can make it difficult to understand key outcomes for young people from ethnic minority backgrounds.

Young people from minority ethnic backgrounds have long experienced higher unemployment and lower wages than their white peers. The impact of the Coronavirus pandemic has only exacerbated these inequalities, with research showing an unequal impact on employment across ethnic groups. In addition, previous work has identified substantial gaps in the collection and analysis of data relating to young people from minority ethnic backgrounds. There are particular concerns around systematic erasure in data collection, lack of observations and small sample sizes, and a lack of culturally relevant data.

  • Employment

Rapid survey

Some text that describes the image

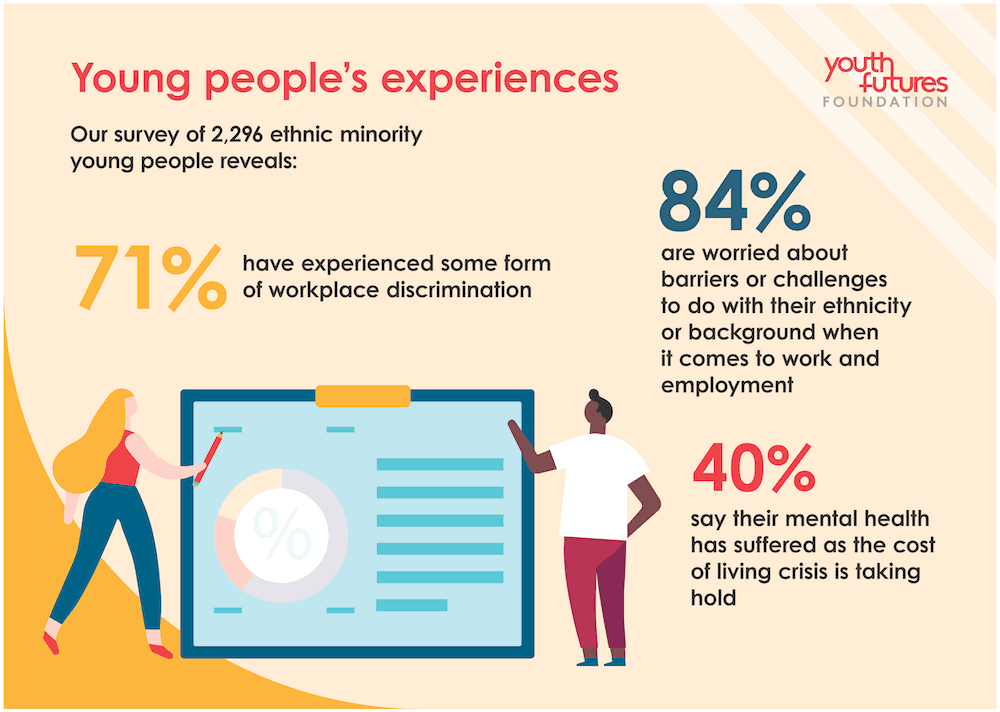
We recognised the need for understanding the impact of discrimination at work as well as rising cost of living for young people from an ethnic minority background.

According to our independent survey of 2,296 ethnic minority young people, seven in 10 (71%) have experienced some form of workplace discrimination. Almost half (46%) of young people from ethnic minority backgrounds have experienced discrimination when dealing with customers or clients at work, while two in five have experienced it when applying for a job (37%) and/or at a job interview (36%). With the cost of living crisis taking hold, two in five (40%) say their mental health has suffered.

  • Employment
  • Aged 16-17
  • Aged 18-24
  • Cost of living